 Русский
 English
Cryptocurrencies:
8125 /
Markets: 110612
Market Cap: $ 2 177 357 951 650 /
24h Vol: $ 40 137 329 484 /
BTC
Dominance: 58.492604804005%
Litecoin: Assessing the odds of LTC sustaining its ongoing bull rally
Litecoin [LTC] managed to outperform most cryptos lately, as it registered over 9% gains in just 24 hours. This was a promising uptick that increased the possibility of a further increase in its price over the coming days.
Interestingly, DYOR.net, a crypto analysis platform, recently posted a tweet that revealed that Litecoin was on the list of the top five bullish trends on the BTC pair.
[Scan results – #Binance – 15m]
Top 5 bullish trends on $BTC pair
1: $PIVX
2: $ICP
3: $LTC
4: $OAX
5: $APE
Top 5 bullish trends on $USDT pair
1: $WTC
2: $LTC
3: $BAL
4: $APE
5: $LRC
All Binance results: https://t.co/NE27I4BsNN
Not buy signals. #DYOR
— DYOR.net (@DYORCryptoBot) December 5, 2022
Read Litecoin’s [LTC] Price Prediction 2023-2024
According to CoinMarketCap, LTC’s price surged over 16% in the past week. At press time, it was trading at $83.33 with a market capitalization of $5,979,961,633.
On-chain data further showed the number of Litecoin wallet addresses continued to grow at a steady pace. The year started from about 117 million wallets to 162 million at the time of writing.
On-chain data shows the number of #Litecoin wallet addresses continues to grow at a steady pace. From the beginning of the year, the number was approximately 117 million wallets. Now, there are 162 million LTC wallets and growing. 🚀🚀 pic.twitter.com/HcLFO8cPja
— Litecoin Foundation ⚡️ (@LTCFoundation) December 4, 2022
Nonetheless, things might turn around soon, as a few on-chain metrics suggested that LTC’s price might fall victim to a plummet in the days to follow.
Santiment’s chart revealed that LTC’s Market Value to Realized Value (MVRV) ratio increased substantially over the past week. This development might indicate a possible market peak, followed by a price decline.
LTC’s Binance funding rate also went down during the last seven days. This pointed towards less traction from the derivatives market.
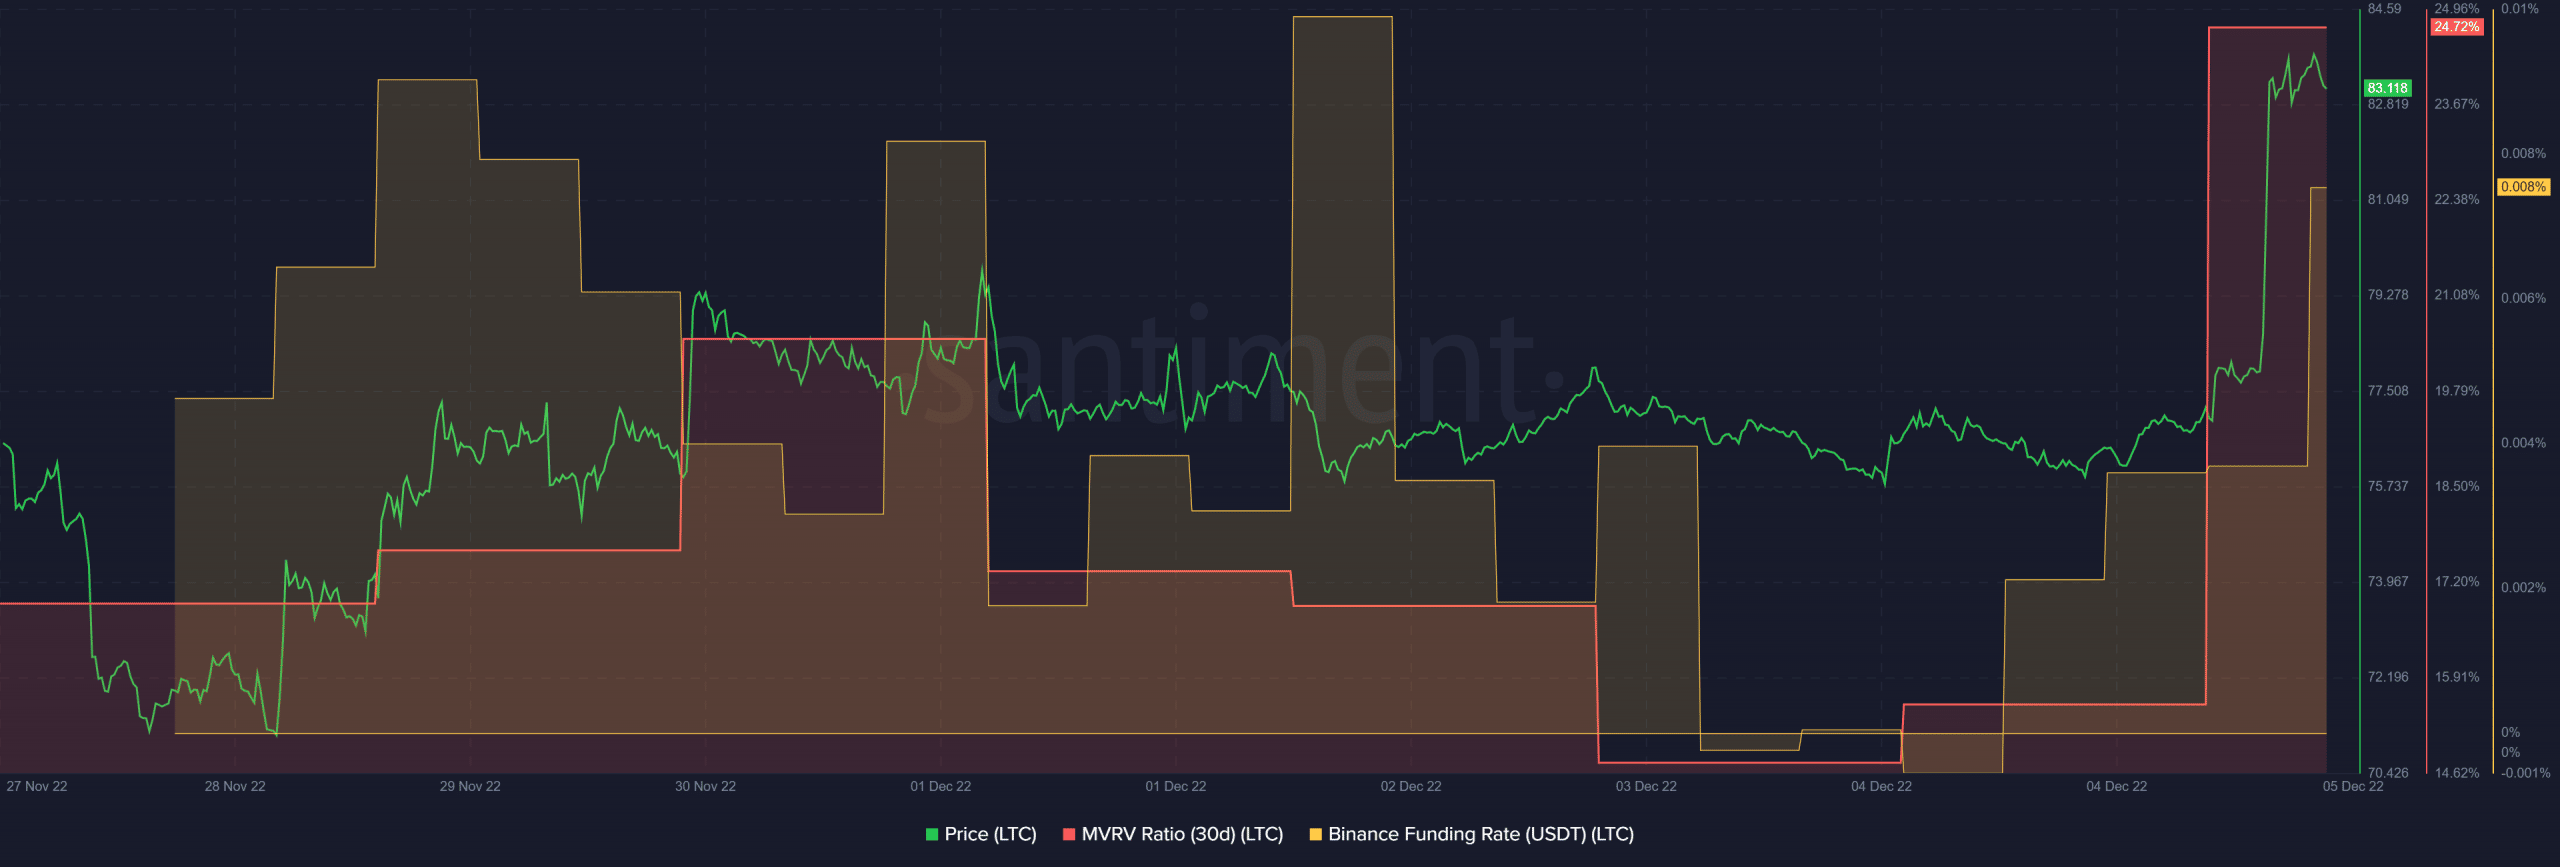
Source: Santiment
Furthermore, LTC’s transaction count declined sharply on 4 November. Litecoin’s velocity also followed a similar route and registered a decline, which can be concerning for the coin.

Source: Santiment
A look at LTC’s daily chart revealed that the bulls were leading the market, but it also suggested the possibility of a trend reversal. For instance, LTC’s Relative Strength Index (RSI) was entering the overbought zone, which is a massive bearish signal. Its Moving Average Convergence Divergence (MACD) indicated that the bulls and the bears were in a tussle.
Nonetheless, the Exponential Moving Average (EMA) ribbon delivered some good news, as the 20-day EMA was above the 55-day EMA. The Chaikin Money Flow (CMF) also registered an uptick, which looked optimistic for Litecoin.
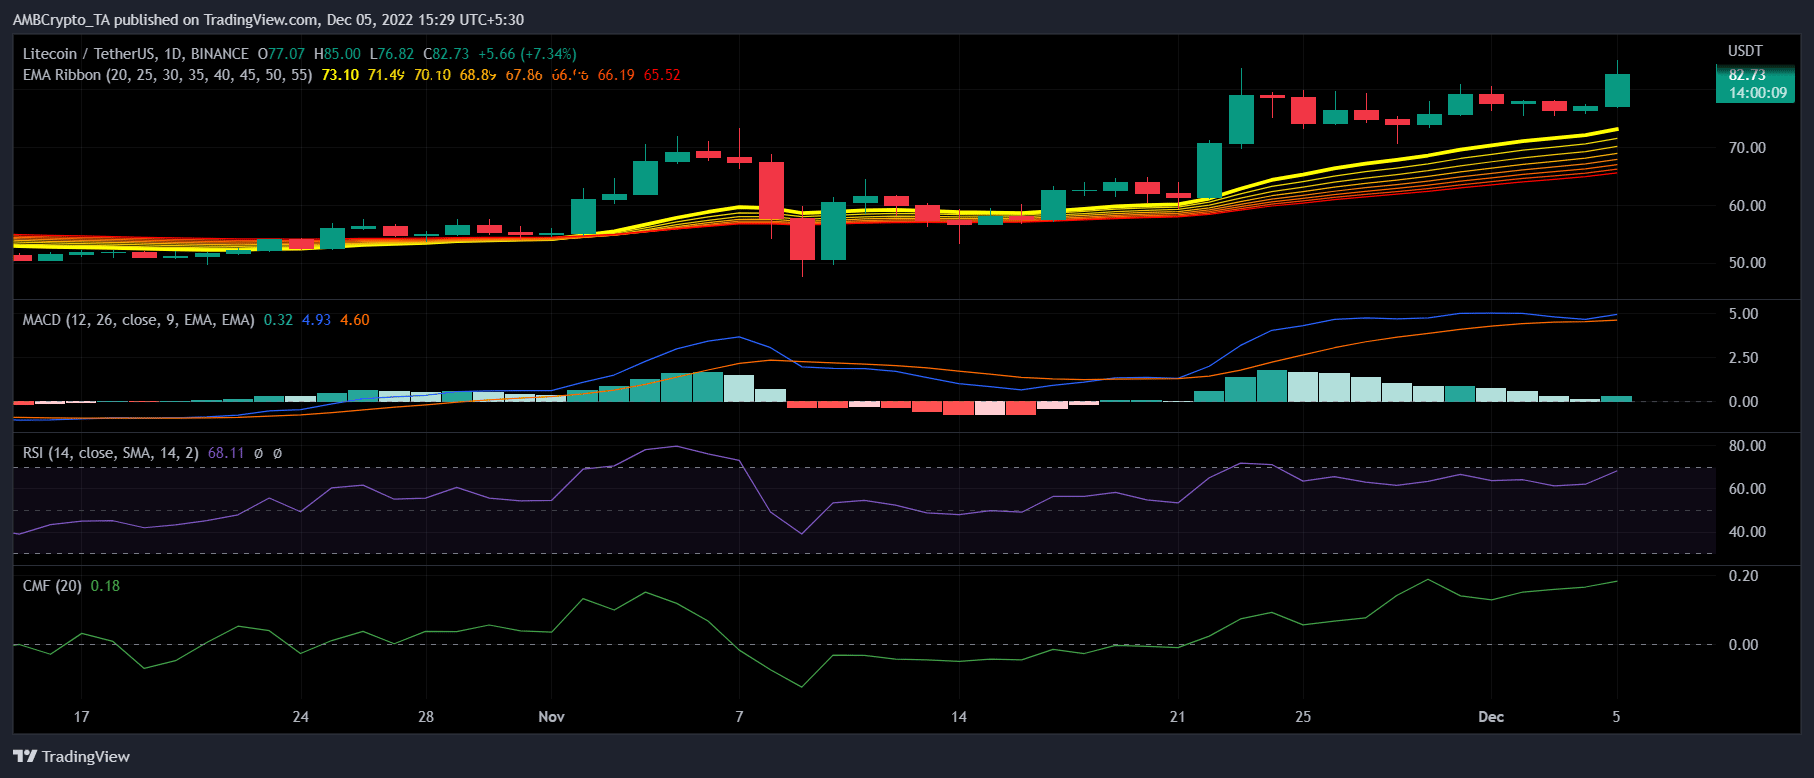
Source: TradingView
-
 15.06.26 12:49
Jason
15.06.26 12:49
Jason
Did a scammer take your money? Fake loan, crypto fraud, romance trap, phishing—they count on you feeling helpless. Prove them wrong. FundsRetriever recovers stolen digital assets fast. No upfront payment. Ever. Backed by the FBI, Interpol, and cybercrime units. Blockchain tracing, legal freezing, and full recovery—for Bitcoin, Ethereum, USDT, Ponzi schemes, you name it. Your move: get a free case review right now. Then forensics, legal action, and your funds back. ⏳ Time is everything. 📧 FUNDSRETRIEVER @ PROTON.ME 📞 +16035121448 (WhatsApp) 📱 Telegram: @FUNDSRETRIEVER
-
 15.06.26 12:56
Hillary
15.06.26 12:56
Hillary
As a blockchain forensic analyst, I’ve reviewed numerous recovery cases. Fundsretriever demonstrates proper on-chain tracing, evidence preservation, and legal coordination. Their methodology helped several of my clients retrieve stolen or stuck assets. Recommended for victims seeking verifiable solutions. 📧 [email protected] Telegram @FUNDSRETRIEVER WhatsApp +1 603 512 1448
-
 15.06.26 13:03
Feliksa Stegniy
15.06.26 13:03
Feliksa Stegniy
A woman added me on Facebook, and after she suggested we become friends, we started communicating. Over time, she introduced me to a crypto trading platform called btctradingfx.com. She shared a lot of information about it, along with screenshots that made the platform seem trustworthy. Convinced by her claims, I decided to give it a try. I was promised a 10% weekly return, so I made an initial investment of $500. To my surprise, I received $5,000 back. That success encouraged me to invest more, so I put in $20,000. But when I tried to withdraw my funds, I was denied access and told I needed to deposit even more money before I could make a withdrawal. In the end, I lost a total of $43,850. It was an extremely difficult and painful experience. Fortunately, I later found a professional recovery service called ResQprofirm while searching on Google. I contacted them and provided all the evidence I had. They took my case seriously and were able to track down and recover my capital from the platform, which had been inaccessible for a long time. If you find yourself in a similar situation, you might consider reaching out to them via email at [email protected] or on WhatsApp at +19852969146, Telegram @resqprofirm Thank you, ResQPro, for your support.
-
15.06.26 13:05
James willson
The Most Credible Crypto Recovery Service: RESQPROFIRM RESQPROFIRM is a reliable, legitimate company that helps recover lost cryptocurrency assets. After weeks of doubting whether my lost BTC could ever be restored, I realized how widespread crypto scams have become. Caution is essential when dealing with strangers online, especially about money. While recovering stolen crypto is possible, avoiding fake "recovery companies" is just as important. Real hackers work discreetly and don't advertise openly. I was scammed multiple times while desperately seeking help. Finally, a friend introduced me to RESQPROFIRM—a trustworthy, discreet team. They handle everything from website security to crypto asset recovery. With their help, I recovered $320,000 in USDT within a week. Their professionalism, discretion, and speed were outstanding. If you've been compromised, don't lose hope—but beware of fraudsters posing as saviors. RESQPROFIRM are true professionals. I'm living proof. Contact them at [email protected], WhatsApp +19852969146, or Telegram @resqprofirm.
-
 15.06.26 13:06
Tansy
15.06.26 13:06
Tansy
Lost $18,500 to a fake Elon Musk crypto giveaway. Sent ETH, got nothing. Recovery pages demanded more gas fees. I stopped believing. FuNds rEtRiEveR on Te.le_gram was the real one. Email: [email protected] – WhatsApp: +1 603 512 1448
-
 15.06.26 13:08
Sarahy billy
15.06.26 13:08
Sarahy billy
A REAL EXPERIENCE, EVERYONE ... PLEASE BE CAREFUL ONLINE A few weeks ago, I lost around $64,000 to a fake crypto trading platform. I was drawn in by the promise of earning 15% profit daily. It was a devastating time—I struggled to pay my bills and was financially ruined. I eventually opened up to a close friend, who recommended a crypto recovery team with highly effective methods. I contacted them, and they successfully recovered all my stolen digital assets with ease. Their service was excellent, and they acted quickly—within just 5 working days, they tracked down the scammers and returned my funds. I strongly urge anyone facing investment theft or similar issues to reach out to this team for the right solution and avoid losing large sums to fraudsters... Email: Resqprofirm @aol.com WhatsApp: +19852969146, telegram @resqprofirm
-
 15.06.26 13:12
Cole donald
15.06.26 13:12
Cole donald
"I strongly recommend RESQPRO FIRM to anyone trying to recover lost cryptocurrency assets, including Bitcoin, USDC, USDT, Ethereum, and Trump Coin. Like many others, I was shocked to learn that crypto holdings can be stolen even when private keys are carefully protected. After a sophisticated hack wiped out my entire portfolio, I felt completely helpless. Fortunately, I was referred to RESQPRO FIRM. Their team understood the complexity of my situation and successfully recovered my funds. They were responsive, communicated clearly, and followed a careful, step-by-step process—which gave me a lot of reassurance during a stressful time. If you've experienced a similar financial loss, I encourage you to reach out to them. Their professionalism and ethical hacking skills exceeded my expectations." Contact Info: · WhatsApp: +1 (985) 2969146 · Email: [email protected] · Telegram: Resqprofirm
-
 15.06.26 13:16
Meral Yetkiner
15.06.26 13:16
Meral Yetkiner
I recently lost $38,000 to an online platform. Initially, they requested additional deposits to grant me access to my portfolio. Despite complying, my withdrawal requests were repeatedly denied, and they continued asking for more funds. Suspecting fraudulent activity, I ceased further payments and promptly reported the matter to ResQProfirm, a firm I discovered through Google. They listened to my situation, initiated communication regarding the sequence of events, and requested all relevant evidence to support their investigation. Through their dedicated efforts, they successfully traced and recovered my funds. I extend my thanks to ResQProfirm at [email protected] and via WhatsApp at +19852969146. I urge everyone to exercise caution and thoroughly research any platform before investing.
-
15.06.26 13:18
Silas Olsen
A fraudulent investment scheme operated by BTCMining.limited functions as a fake return scam. In this setup, scammers lure victims with false promises of high returns. Through manipulative tactics, they gain individuals' trust and convince them to invest, ultimately leading to financial loss. If you have ever faced a cyber threat or fallen victim to an online crypto scam and need to reach the authorities, I recommend contacting [email protected]. They are a legitimate team that helps victims of online crypto scams using advanced tools.
-
 15.06.26 13:59
Ewaguz
15.06.26 13:59
Ewaguz
If a binary options broker refuses your withdrawal, do not pay any "verification fees" or "tax fees." These are lies designed to extract more money. Stop communicating with their support team – they are trained to stall. Instead, immediately document every transaction, screenshot your account balance, and contact a professional recovery specialist. BinaryBook stole €14,500 from me before I learned this. FundsRetriever traced the deposits and recovered everything within two weeks. Do not wait. Do not pay more fees. Act now. Contact [email protected], WhatsApp +1(603)5121(448) or Telegram FUNDSRETRIEVER.
-
15.06.26 14:16
Martina k.
Stop putting money into platforms promising guaranteed monthly returns of 10%, 20%, or more. These are Ponzi schemes. Your "profits" are just other victims' deposits. The moment withdrawals slow down, the scam is about to collapse. If you already have money trapped, do not send more to "unlock" your funds. That is a second scam. Instead, gather all transaction hashes and wallet addresses. Bitcoin Evolution Pro took €25,000 from me. FundsRetriever traced the funds through KYC exchanges and recovered my principal. Contact [email protected], WhatsApp +1(603)5121(448) or Telegram FUNDSRETRIEVER.
-
 15.06.26 14:18
Garrison Good
15.06.26 14:18
Garrison Good
If IQ Option or any similar platform blocks your withdrawal citing "bonus terms" or "abnormal activity," do not argue with their chat support. They are not empowered to help you. Instead, request all trade logs and bonus terms in writing. Then hire a forensic specialist to audit your account. IQ Option held my €9,200 for two months. FundsRetriever reviewed my case, identified regulatory violations, and secured my full payout within 72 hours. Professional pressure works. Do it immediately. Contact [email protected], WhatsApp +1(603)5121(448) or Telegram FUNDSRETRIEVER.
-
15.06.26 14:22
Sallymarch
Never grant API keys with withdrawal permissions to any third-party software. This is how crypto arbitrage bots steal your funds. If you have already done this, revoke all API keys immediately. Then check your exchange transaction history. CryptoArb AI drained €7,800 from my account within hours. FundsRetriever reverse-engineered the bot's code, traced the scammer's wallet, and recovered everything. Always use "read-only" API permissions only. If you made the mistake, act fast. Contact [email protected], WhatsApp +1(603)5121(448) or Telegram FUNDSRETRIEVER.
-
15.06.26 14:23
Glennrobble
If a binary options broker closes your account and confiscates your profits, do not accept their explanation. Demand a full audit of your trade history. Most brokers cannot justify their actions when challenged by professionals. ExpertOption stole €6,200 from me claiming "abnormal activity." FundsRetriever audited my trades, proved they were legitimate, and threatened legal action. The broker paid within 10 days. Do not let them intimidate you. Get professional help. Contact [email protected], WhatsApp +1(603)5121(448) or Telegram FUNDSRETRIEVER.
-
15.06.26 14:25
Evan Garrison
Cloud mining contracts are almost always too good to be true. I learned that the hard way with MineMax. First two months, small daily payouts. Then "maintenance fees" ate everything. Then my account was frozen. Then the website disappeared. I was heartbroken. FundsRetriever traced my payments through three shell companies to a real bank account. They froze it and got my €11,000 back. Recovery is possible even from complex scams. Contact [email protected], WhatsApp +1(603)5121(448) or Telegram FUNDSRETRIEVER.
-
15.06.26 14:26
Ewaguz
That 100% deposit bonus looks tempting, doesn't it? I took it. Big mistake. When I tried to withdraw my €4,500, Olymp Trade demanded I trade 50 times the bonus amount. Impossible by design. My money was trapped. FundsRetriever reviewed the terms and found they violated consumer protection laws in my country. They negotiated directly with Olymp Trade's legal team. Within a week, my funds were released. My advice? Never accept bonuses. But if you're already trapped, call [email protected], WhatsApp +1(603)5121(448) or Telegram FUNDSRETRIEVER.
-
 15.06.26 16:34
robertalfred175
15.06.26 16:34
robertalfred175
CRYPTO SCAM RECOVERY SUCCESSFUL – A TESTIMONIAL OF LOST PASSWORD TO YOUR DIGITAL WALLET BACK. My name is Robert Alfred, Am from Australia. I’m sharing my experience in the hope that it helps others who have been victims of crypto scams. A few months ago, I fell victim to a fraudulent crypto investment scheme linked to a broker company. I had invested heavily during a time when Bitcoin prices were rising, thinking it was a good opportunity. Unfortunately, I was scammed out of $120,000 AUD and the broker denied me access to my digital wallet and assets. It was a devastating experience that caused many sleepless nights. Crypto scams are increasingly common and often involve fake trading platforms, phishing attacks, and misleading investment opportunities. In my desperation, a friend from the crypto community recommended Capital Crypto Recovery Service, known for helping victims recover lost or stolen funds. After doing some research and reading multiple positive reviews, I reached out to Capital Crypto Recovery. I provided all the necessary information—wallet addresses, transaction history, and communication logs. Their expert team responded immediately and began investigating. Using advanced blockchain tracking techniques, they were able to trace the stolen Dogecoin, identify the scammer’s wallet, and coordinate with relevant authorities to freeze the funds before they could be moved. Incredibly, within 24 hours, Capital Crypto Recovery successfully recovered the majority of my stolen crypto assets. I was beyond relieved and truly grateful. Their professionalism, transparency, and constant communication throughout the process gave me hope during a very difficult time. If you’ve been a victim of a crypto scam, I highly recommend them with full confidence contacting: Email: [email protected] Telegram: @Capitalcryptorecover Contact: [email protected] Call/Text: +1 (336) 390-6684 Website: https://recovercapital.wixsite.com/capital-crypto-rec-1
-
 15.06.26 16:41
Louane Mercier
15.06.26 16:41
Louane Mercier
It is crucial to act quickly and consult a reputable, experienced recovery specialist who will support you throughout the entire recovery process. You must provide them with transaction evidence, scammer information, and any other relevant details that could aid the investigation. With this data, the experts can trace and attempt to recover your funds from the scammers' concealed accounts or wallets. R£sQprofirm company offers recovery assistance with no upfront fees. Contact them via Telegram (@ResQprofirm), WhatsApp (+19852969146), or email ([email protected]).
-
 15.06.26 16:45
Andrés Montero
15.06.26 16:45
Andrés Montero
I’m open about my experience with Bitcoin investment and losing money to scammers. That said, it is possible to recover stolen Bitcoin. I used to think recovery was impossible because that’s what I had been told. But last October, I fell for a forex scam promising extremely high returns and ended up losing nearly $87,600. After searching for help for a month, I came across a Reddit article about recovering stolen cryptocurrency. I reached out to the contact provided: [email protected] and WhatsApp +19852969146. I was scared and skeptical, having heard many bad stories, but I decided to give them a try. To my amazement, I got all my stolen Bitcoin back within a very short time. I’m not sure if I’m allowed to post links here, but you can reach out to them if you also need help.
-
 15.06.26 16:48
Olivia Sørensen
15.06.26 16:48
Olivia Sørensen
Several months ago, investing in Bitcoin proved to be one of my most lucrative endeavors. I achieved considerable profits across multiple platforms and felt a strong sense of accomplishment. Unfortunately, the situation deteriorated when I inadvertently engaged with a fraudulent Bitcoin platform. This entity swindled me out of $92,000 USD, refused to honor my withdrawal requests, and persistently demanded further deposits. Fortunately, I encountered (R£SQPRO FIRM) online. After reporting my case to them, they acted promptly and effectively recovered my lost Bitcoin. I am sincerely grateful for their professionalism and continuous assistance. Contact: ResQprofirm AT aol.com, Telegram @resqprofirm, WhatsApp +1 9 8 5 2 9 6 9 1 4 6.
-
 15.06.26 16:51
Viljar Yohannes
15.06.26 16:51
Viljar Yohannes
I'm willing to share my experience with Bitcoin investment and losing money to scammers. But yes, recovering stolen Bitcoin is possible. I never believed in Bitcoin recovery myself, because I was told it couldn't be done. Then, last October, I fell for a forex scam that promised unrealistically high returns, and I ended up losing nearly $70,000. I searched for help for about a month until I finally found a Reddit article about recovering stolen cryptocurrency. I reached out to the contact mentioned: [RESQPROFIRM [at] AOL DOT com] and [WhatsApp +19852969146]. I was scared and skeptical because I'd heard horror stories, but I decided to give them a try. To my surprise, I got all my stolen Bitcoin back from the scammers in a very short time. I'm not sure if I'm allowed to post links here, but you can contact them if you need help too.
-
15.06.26 16:58
Guimar da Rosa
Withdrawal troubles shouldn’t stress you out. I faced a similar problem, and this firm stepped in and recovered my funds. Their support truly mattered. Contact them: [ResQProFirm @aol.com] telegram @resqprofirm, WhatsApp: <+198> <5296> <9146>.
-
15.06.26 17:03
Andrea Escalante
If withdrawals keep getting denied, stay calm. I went through the same, and this firm helped me recover everything. Their assistance was outstanding. Contact: [[email protected]], Telegram: ResQprofirm, WhatsApp: <+198> <5296> <9146>. Withdrawal troubles shouldn’t
-
16.06.26 11:40
robertalfred175
CRYPTO SCAM RECOVERY SUCCESSFUL – A TESTIMONIAL OF LOST PASSWORD TO YOUR DIGITAL WALLET BACK. My name is Robert Alfred, Am from Australia. I’m sharing my experience in the hope that it helps others who have been victims of crypto scams. A few months ago, I fell victim to a fraudulent crypto investment scheme linked to a broker company. I had invested heavily during a time when Bitcoin prices were rising, thinking it was a good opportunity. Unfortunately, I was scammed out of $120,000 AUD and the broker denied me access to my digital wallet and assets. It was a devastating experience that caused many sleepless nights. Crypto scams are increasingly common and often involve fake trading platforms, phishing attacks, and misleading investment opportunities. In my desperation, a friend from the crypto community recommended Capital Crypto Recovery Service, known for helping victims recover lost or stolen funds. After doing some research and reading multiple positive reviews, I reached out to Capital Crypto Recovery. I provided all the necessary information—wallet addresses, transaction history, and communication logs. Their expert team responded immediately and began investigating. Using advanced blockchain tracking techniques, they were able to trace the stolen Dogecoin, identify the scammer’s wallet, and coordinate with relevant authorities to freeze the funds before they could be moved. Incredibly, within 24 hours, Capital Crypto Recovery successfully recovered the majority of my stolen crypto assets. I was beyond relieved and truly grateful. Their professionalism, transparency, and constant communication throughout the process gave me hope during a very difficult time. If you’ve been a victim of a crypto scam, I highly recommend them with full confidence contacting: Email: [email protected] Telegram: @Capitalcryptorecover Contact: [email protected] Call/Text: +1 (336) 390-6684 Website: https://recovercapital.wixsite.com/capital-crypto-rec-1
-
16.06.26 11:43
robertalfred175
CRYPTO SCAM RECOVERY SUCCESSFUL – A TESTIMONIAL OF LOST PASSWORD TO YOUR DIGITAL WALLET BACK. My name is Robert Alfred, Am from Australia. I’m sharing my experience in the hope that it helps others who have been victims of crypto scams. A few months ago, I fell victim to a fraudulent crypto investment scheme linked to a broker company. I had invested heavily during a time when Bitcoin prices were rising, thinking it was a good opportunity. Unfortunately, I was scammed out of $120,000 AUD and the broker denied me access to my digital wallet and assets. It was a devastating experience that caused many sleepless nights. Crypto scams are increasingly common and often involve fake trading platforms, phishing attacks, and misleading investment opportunities. In my desperation, a friend from the crypto community recommended Capital Crypto Recovery Service, known for helping victims recover lost or stolen funds. After doing some research and reading multiple positive reviews, I reached out to Capital Crypto Recovery. I provided all the necessary information—wallet addresses, transaction history, and communication logs. Their expert team responded immediately and began investigating. Using advanced blockchain tracking techniques, they were able to trace the stolen Dogecoin, identify the scammer’s wallet, and coordinate with relevant authorities to freeze the funds before they could be moved. Incredibly, within 24 hours, Capital Crypto Recovery successfully recovered the majority of my stolen crypto assets. I was beyond relieved and truly grateful. Their professionalism, transparency, and constant communication throughout the process gave me hope during a very difficult time. If you’ve been a victim of a crypto scam, I highly recommend them with full confidence contacting: Email: [email protected] Telegram: @Capitalcryptorecover Contact: [email protected] Call/Text: +1 (336) 390-6684 Website: https://recovercapital.wixsite.com/capital-crypto-rec-1
-
16.06.26 13:37
Felix Steve
MY CRYPTO WAS STOLEN – HERE'S HOW I GOT IT BACK I'm Felix Steve from Canada, and I lost $115,000 USDC to a fraudulent broker who locked me out of my wallet. After sleepless nights, a friend told me about RESQPROFIRM Recovery Service. I sent them my wallet addresses, transaction history, and chat logs. Their team used blockchain tracking to trace the stolen funds, identified the scammer's wallet, and froze the assets before they could be moved. Within 24 hours, most of my crypto was recovered. I can't thank them enough. If you need help, reach out via WhatsApp: +19852969146, email: [email protected], or TG: @resqprofirm.
-
 16.06.26 13:45
Wills ben
16.06.26 13:45
Wills ben
SUCCESSFUL CRYPTO SCAM RECOVERY – HOW I REGAINED ACCESS TO MY LOST WALLET My name is Felix Steve, and I'm from Canada. I'm sharing my story to help others who have fallen victim to crypto fraud. A few months ago, I was lured into a fake investment scheme promoted by a broker company. With Bitcoin prices climbing, I invested heavily—only to lose $115,000 USDC when the broker locked me out of my wallet and assets. It was a harrowing experience that left me sleepless and desperate. Crypto scams are on the rise, often involving bogus trading platforms, phishing, and misleading promises. In my search for help, a fellow crypto enthusiast recommended RESQPROFIRM Recovery Service, which specializes in recovering lost or stolen funds. After checking their reviews, I reached out and supplied all the evidence—wallet addresses, transaction records, and communication logs. Their team responded immediately and launched an investigation. Using advanced blockchain tracking, they traced the stolen funds, pinpointed the scammer's wallet, and worked with authorities to freeze the assets in time. Remarkably, within just 24 hours, RESQPROFIRM recovered the bulk of my stolen crypto. I was overwhelmed with relief and gratitude. Their professionalism, transparency, and steady communication made all the difference during a very dark period. If you've been scammed, I wholeheartedly recommend contacting them via WhatsApp: +19852969146, email: [email protected], or Telegram: @resqprofirm.
-
 18.06.26 13:31
Noemi Bernard
18.06.26 13:31
Noemi Bernard
I never expected such outstanding results. The outcome far exceeded my expectations, and I am extremely satisfied with the successful recovery of my stolen funds totaling $49,360 from my blockchain wallet. I hold this team in the highest regard. Without a doubt, they are among the most dedicated professionals in the field of fund recovery. Keep up the exceptional work! Email: [email protected] WhatsApp: +1 985 296 9146
-
18.06.26 13:35
Carter Morris
My experience improved significantly thanks to ResQprofirm's expert assistance and attentive customer care. Their professionalism was evident every step of the way they were able to track and recover my stolen crypto $88,360, email: [email protected], WhatsApp +19852969146.
-
 18.06.26 13:40
Kuybida Andriyiv
18.06.26 13:40
Kuybida Andriyiv
I recovered my $232,000 refund through the assistance of [email protected] and WhatsApp +19852969146. Their guidance was very helpful.
-
20.06.26 14:57
michaeldavenport218
I was recently scammed out of $53,000 by a fraudulent Bitcoin investment scheme, which added significant stress to my already difficult health issues, as I was also facing cancer surgery expenses. Desperate to recover my funds, I spent hours researching and consulting other victims, which led me to discover the excellent reputation of Capital Crypto Recover, I came across a Google post It was only after spending many hours researching and asking other victims for advice that I discovered Capital Crypto Recovery’s stellar reputation. I decided to contact them because of their successful recovery record and encouraging client testimonials. I had no idea that this would be the pivotal moment in my fight against cryptocurrency theft. Thanks to their expert team, I was able to recover my lost cryptocurrency back. The process was intricate, but Capital Crypto Recovery's commitment to utilizing the latest technology ensured a successful outcome. I highly recommend their services to anyone who has fallen victim to cryptocurrency fraud. For assistance contact [email protected] and on Telegram OR Call Number +1 (336)390-6684 via email: [email protected] you can visit his website: https://recovercapital.wixsite.com/capital-crypto-rec-1
-
21.06.26 11:09
Maurizio Rolland
I would like to express my sincere appreciation to RESQPRO FIRM for their outstanding assistance in helping victims of online fraud. Many scammers deceive investors by blocking withdrawals and continuously demanding additional deposits, making the loss of hard-earned funds a painful experience. Fortunately, RESQPRO FIRM provides support to individuals seeking to recover funds lost to fraudulent online schemes. Contact: Email: RESQPRO FIRM at Gmail Telegram: RESQPROFIRM, [email protected], WhatsApp: +1 985 296 9146
-
 21.06.26 11:13
Buse Fahri
21.06.26 11:13
Buse Fahri
It is important for more people to stand together in the fight against online fraud. Those who target innocent individuals especially vulnerable people such as seniors should be held fully accountable for their actions. Every effort to raise awareness and support victims makes a meaningful difference. The team at RESQPRO FIRM is committed to helping expose fraudulent schemes and assisting those affected by online scams. Their dedication, persistence, and passion for protecting victims are truly commendable. I sincerely appreciate the hard work and commitment shown toward this mission. Together, we can continue to educate others, support victims, and work toward a safer online environment for everyone. Contact Information: Telegram: RESQPROFIRM WhatsApp: +1 985 296 9146 Email: [email protected], [email protected]
-
 21.06.26 11:16
علیرضا گلشن
21.06.26 11:16
علیرضا گلشن
The successful recovery of my stolen funds, totaling $1,310,000, would not have been possible without your unwavering support, dedication, and tireless efforts. I am truly grateful for the opportunity to work with such a skilled and professional team. From the very beginning, I had confidence in your ability to handle this challenging situation, and you exceeded my expectations by delivering remarkable results. Your expertise, persistence, and commitment throughout the process were exceptional. I encourage you to continue maintaining the high standards of professionalism and excellence that distinguish your work. You exemplify the qualities of a trustworthy, dedicated, and hardworking professional, and your efforts deserve sincere recognition and appreciation. Contact: Email: [email protected], [email protected], Telegram: Resqprofirm WhatsApp: +1 985 296 9146
-
22.06.26 21:51
kimberlyhebert786
I invested in bitcoin trading After losing $78.4 USDT) linked to a romance fraud scam worth of cryptocurrency through an online investment platform and later discovered it was a scam. After extensive research for recovery options, I contacted CAPITAL CRYPTO RECOVER based on positive client reviews and recommendations. Their professional security team guided me through the recovery process using advanced technology, and I was able to recover my lost cryptocurrency successfully. I am truly grateful for their support and assistance during such a difficult experience. I will advise you to contact CAPITAL CRYPTO RECOVER helped me recover my funds. For anyone facing similar issues, Website: https://recovercapital.wixsite.com/capital-crypto-rec-1 Email: [email protected] Telegram: @Capitalcryptorecover Contact: [email protected] Call/Text Number: +1 (336) 390-6684
-
24.06.26 01:25
Fraddy Pual
I never thought it would happen to me—but I lost $256,100 in Bitcoin through a shady investment deal. I was shattered, panicked, and convinced my savings were gone forever. Just when I was about to give up, I stumbled upon reviews for FUNDSRETRIEVER, a cyber recovery team with a solid reputation. I decided to give it a shot, and to my absolute shock, they recovered every single cent in record time. Working with them was a lifesaver. If you've been tricked by fake investment platforms, don't lose hope—FUNDSRETRIEVER can help. Contact them here: Email: [email protected] | WhatsApp: +1603512144 8| Telegram: @Fundsretriever
-
24.06.26 01:27
Fraddy Pual
I never thought it would happen to me—but I lost $256,100 in Bitcoin through a shady investment deal. I was shattered, panicked, and convinced my savings were gone forever. Just when I was about to give up, I stumbled upon reviews for FUNDSRETRIEVER, a cyber recovery team with a solid reputation. I decided to give it a shot, and to my absolute shock, they recovered every single cent in record time. Working with them was a lifesaver. If you've been tricked by fake investment platforms, don't lose hope—FUNDSRETRIEVER can help. Contact them here: Email: [email protected] | WhatsApp: +16035121448 | Telegram: @Fundsretriever
-
24.06.26 01:28
Fraddy Pual
I never thought it would happen to me—but I lost $256,100 in Bitcoin through a shady investment deal. I was shattered, panicked, and convinced my savings were gone forever. Just when I was about to give up, I stumbled upon reviews for FUNDSRETRIEVER, a cyber recovery team with a solid reputation. I decided to give it a shot, and to my absolute shock, they recovered every single cent in record time. Working with them was a lifesaver. If you've been tricked by fake investment platforms, don't lose hope—FUNDSRETRIEVER can help. Contact them here: Email: [email protected] | WhatsApp: +16035121448 | Telegram: @Fundsretriever.
-
24.06.26 01:58
robertalfred175
CRYPTO SCAM RECOVERY SUCCESSFUL – A TESTIMONIAL OF LOST PASSWORD TO YOUR DIGITAL WALLET BACK. My name is Robert Alfred, Am from Australia. I’m sharing my experience in the hope that it helps others who have been victims of crypto scams. A few months ago, I fell victim to a fraudulent crypto investment scheme linked to a broker company. I had invested heavily during a time when Bitcoin prices were rising, thinking it was a good opportunity. Unfortunately, I was scammed out of $120,000 AUD and the broker denied me access to my digital wallet and assets. It was a devastating experience that caused many sleepless nights. Crypto scams are increasingly common and often involve fake trading platforms, phishing attacks, and misleading investment opportunities. In my desperation, a friend from the crypto community recommended Capital Crypto Recovery Service, known for helping victims recover lost or stolen funds. After doing some research and reading multiple positive reviews, I reached out to Capital Crypto Recovery. I provided all the necessary information—wallet addresses, transaction history, and communication logs. Their expert team responded immediately and began investigating. Using advanced blockchain tracking techniques, they were able to trace the stolen Dogecoin, identify the scammer’s wallet, and coordinate with relevant authorities to freeze the funds before they could be moved. Incredibly, within 24 hours, Capital Crypto Recovery successfully recovered the majority of my stolen crypto assets. I was beyond relieved and truly grateful. Their professionalism, transparency, and constant communication throughout the process gave me hope during a very difficult time. If you’ve been a victim of a crypto scam, I highly recommend them with full confidence contacting: Email: [email protected] Telegram: @Capitalcryptorecover Contact: [email protected] Call/Text: +1 (336) 390-6684 Website: https://recovercapital.wixsite.com/capital-crypto-rec-1
-
 24.06.26 14:16
Universina da Mota
24.06.26 14:16
Universina da Mota
Becoming a victim of an investment scam is never anyone's intention it often happens because fraudsters exploit trust and a lack of awareness. I would like to express my sincere gratitude to the dedicated team at ResQpro for their professionalism and commitment to helping victims of online investment fraud. Their efforts in assisting individuals with the recovery of stolen assets and holding scammers accountable are truly commendable. If you need assistance or would like to learn more, you can contact them through: Email: [email protected] Alternative Email: [email protected] Telegram: @ResQprofirm WhatsApp: +1 (985) 296-9146
-
24.06.26 14:21
Elizabeth Thompson
If you believe you have been the victim of an investment scam, it is important to act promptly and gather all relevant information. Keep records of transaction receipts, wallet addresses, communication logs, account details, and any other evidence related to the incident. Providing accurate documentation can help investigators, financial institutions, legal professionals, or recovery specialists review your case and determine what options may be available. Be cautious of anyone who guarantees the recovery of lost funds or requests large upfront payments. For additional information, you may contact: Email: [email protected] Telegram: @ResQprofirm WhatsApp: +1 (985) 296-9146
-
24.06.26 15:33
Júlia Castro
If you have fallen victim to an investment scam, it is important to act quickly and gather all available evidence related to the incident. This may include transaction records, wallet addresses, screenshots of conversations, emails, account details, and any information connected to the individuals or entities involved. Having complete documentation can help professionals assess your situation and explore possible recovery options. Always exercise caution when seeking assistance and carefully verify the credentials of any service provider before proceeding. For further information, you may contact: Email: [email protected] Telegram: @ResQprofirm WhatsApp: +1 (985) 296-9146
-
24.06.26 22:01
robertalfred175
CRYPTO SCAM RECOVERY SUCCESSFUL – A TESTIMONIAL OF LOST PASSWORD TO YOUR DIGITAL WALLET BACK. My name is Robert Alfred, Am from Australia. I’m sharing my experience in the hope that it helps others who have been victims of crypto scams. A few months ago, I fell victim to a fraudulent crypto investment scheme linked to a broker company. I had invested heavily during a time when Bitcoin prices were rising, thinking it was a good opportunity. Unfortunately, I was scammed out of $120,000 AUD and the broker denied me access to my digital wallet and assets. It was a devastating experience that caused many sleepless nights. Crypto scams are increasingly common and often involve fake trading platforms, phishing attacks, and misleading investment opportunities. In my desperation, a friend from the crypto community recommended Capital Crypto Recovery Service, known for helping victims recover lost or stolen funds. After doing some research and reading multiple positive reviews, I reached out to Capital Crypto Recovery. I provided all the necessary information—wallet addresses, transaction history, and communication logs. Their expert team responded immediately and began investigating. Using advanced blockchain tracking techniques, they were able to trace the stolen Dogecoin, identify the scammer’s wallet, and coordinate with relevant authorities to freeze the funds before they could be moved. Incredibly, within 24 hours, Capital Crypto Recovery successfully recovered the majority of my stolen crypto assets. I was beyond relieved and truly grateful. Their professionalism, transparency, and constant communication throughout the process gave me hope during a very difficult time. If you’ve been a victim of a crypto scam, I highly recommend them with full confidence contacting: Email: [email protected] Telegram: @Capitalcryptorecover Contact: [email protected] Call/Text: +1 (336) 390-6684 Website: https://recovercapital.wixsite.com/capital-crypto-rec-1
-
25.06.26 21:13
Emilie Safi
A fraudulent investment scheme operated by BTCMining.limited functions as a fake return scam. In this setup, scammers lure victims with false promises of high returns. Through manipulative tactics, they gain individuals' trust and convince them to invest, ultimately leading to financial loss. If you have ever faced a cyber threat or fallen victim to an online crypto scam and need to reach the authorities, I recommend contacting [email protected], [email protected], WhatsApp +19852969146, telegram @resqprofirm. They are a legitimate team that helps victims of online crypto scams using advanced tools.
-
25.06.26 21:25
Emilie Safi
So I ended up losing $38,000 to this platform. At first, they kept asking me to put in more money so I could get into my portfolio. I did that, but then they wouldn’t let me withdraw anything—just kept asking for more deposits. It got way too suspicious, so I stopped. I found this company called ResQProfirm on Google and told them what happened. They got in touch, asked me to walk them through everything, and I gave them all the proof I had. They did an amazing job tracking down my money and getting it back. Big thanks to them at [email protected] and on WhatsApp at +19852969146. Please be careful out there and always research before investing.
-
26.06.26 01:04
robertalfred175
CRYPTO SCAM RECOVERY SUCCESSFUL – A TESTIMONIAL OF LOST PASSWORD TO YOUR DIGITAL WALLET BACK. My name is Robert Alfred, Am from Australia. I’m sharing my experience in the hope that it helps others who have been victims of crypto scams. A few months ago, I fell victim to a fraudulent crypto investment scheme linked to a broker company. I had invested heavily during a time when Bitcoin prices were rising, thinking it was a good opportunity. Unfortunately, I was scammed out of $120,000 AUD and the broker denied me access to my digital wallet and assets. It was a devastating experience that caused many sleepless nights. Crypto scams are increasingly common and often involve fake trading platforms, phishing attacks, and misleading investment opportunities. In my desperation, a friend from the crypto community recommended Capital Crypto Recovery Service, known for helping victims recover lost or stolen funds. After doing some research and reading multiple positive reviews, I reached out to Capital Crypto Recovery. I provided all the necessary information—wallet addresses, transaction history, and communication logs. Their expert team responded immediately and began investigating. Using advanced blockchain tracking techniques, they were able to trace the stolen Dogecoin, identify the scammer’s wallet, and coordinate with relevant authorities to freeze the funds before they could be moved. Incredibly, within 24 hours, Capital Crypto Recovery successfully recovered the majority of my stolen crypto assets. I was beyond relieved and truly grateful. Their professionalism, transparency, and constant communication throughout the process gave me hope during a very difficult time. If you’ve been a victim of a crypto scam, I highly recommend them with full confidence contacting: Email: [email protected] Telegram: @Capitalcryptorecover Contact: [email protected] Call/Text: +1 (336) 390-6684 Website: https://recovercapital.wixsite.com/capital-crypto-rec-1
-
26.06.26 02:48
Miriam Rocha
I trusted this platform with $120,000 of my hard-earned money. Then they started asking for more deposits just so I could access my own portfolio. I paid, but every withdrawal request was denied. They kept pushing for more money. I finally stopped it just felt wrong. Desperate, I found ResQProfirm on Google. They didn't just hear me out; they truly listened. I shared all my proof, and they launched an investigation. Thanks to their hard work, they tracked and returned my funds. From the bottom of my heart, thank you to [email protected] and their WhatsApp +19852969146. Please stay safe and always verify a platform before investing
-
26.06.26 02:52
Miško Bakić
I got my $232,000 refund thanks to [email protected] and WhatsApp +19852969146. Highly recommended for anyone in a similar situation.
-
26.06.26 02:56
Asunción Herrera
A recovery of $48,330 was facilitated by [email protected]. Individuals who have experienced financial fraud may consider contacting this service.
-
26.06.26 15:05
Riley Stephens
If withdrawals keep getting denied, stay calm. I went through the same, and this firm helped me recover everything. Their assistance was outstanding. Contact: [ResQProFirm @Gmail|•|com], Telegram: ResQprofirm, WhatsApp: <+198> <5296> <9146>.
-
26.06.26 15:09
Antonio Riley
Withdrawal troubles shouldn’t stress you out. I faced a similar problem, and this firm stepped in and recovered my funds. Their support truly mattered. Contact them: [[email protected], ResQprofirm @aol.com], Telegram: ResQprofirm, WhatsApp: +19852969146.
-
28.06.26 00:37
kimberlyhebertt673
I invested in bitcoin trading After losing $78.4 USDT) linked to a romance fraud scam worth of cryptocurrency through an online investment platform and later discovered it was a scam. After extensive research for recovery options, I contacted CAPITAL CRYPTO RECOVER based on positive client reviews and recommendations. Their professional security team guided me through the recovery process using advanced technology, and I was able to recover my lost cryptocurrency successfully. I am truly grateful for their support and assistance during such a difficult experience. I will advise you to contact CAPITAL CRYPTO RECOVER helped me recover my funds. For anyone facing similar issues, Website: https://recovercapital.wixsite.com/capital-crypto-rec-1 Email: [email protected] Telegram: @Capitalcryptorecover Contact: [email protected] Call/Text Number: +1 (336) 390-6684
-
29.06.26 11:57
Lisadonato0726
For 43 years, I struggled with bad credit due to my own poor decisions, and my credit score was around 490. When my girlfriend and I decided to buy a house, a mortgage broker informed us that it would be impossible to secure a mortgage with my credit score. As a result, she referred me to a company called HACK MAVENS CREDIT SPECIALIST, assuring me of their professionalism and ability to assist with credit improvement. Upon contacting them, I was impressed by their professionalism and they assured me that they could help. In less than 6 days, my credit score skyrocketed to 785, and they also successfully resolved issues in my credit report, including the bankruptcy. I am incredibly satisfied with their service and would highly recommend HACK MAVENS CREDIT SPECIALIST for reliable credit repairs. You can reach them at H A C K M A V E N S 5 [AT] G M A I L [DOT] COM or at [+] [1] [2 0 9] [4 1 7] – [1 9 5 7]. Thanks to their help, my girlfriend and I are now proud homeowners.
-
29.06.26 22:37
riley777
Back in 2025, I watched my life savings vanish. A thief took every cent. I felt desperate and went looking for a way to get it back. I found a guy here who said he was an expert haha. He talked about special software that could find my missing cash. I trusted him. That was a big mistake. He was just another scammer. I paid him a software fee and then he just stopped answering my texts and ran off with my money too. I felt so ashamed that I kept quiet about it for months. It is hard to admit you got fooled twice. Later on, I found a real pro. she did not use a fancy sales pitch. she just looked at the trans screenshots and followed the path the money took. she worked fast and got my funds back into my account. Having that money back changed everything. I can sleep again. her info; [email protected]. Call/chatroom on Whtasapp/ +44 7476618364.
-
30.06.26 15:08
wendytaylor015
My name is Wendy Taylor, I'm from Los Angeles, i want to announce to you Viewer how Capital Crypto Recover help me to restore my Lost Bitcoin, I invested with a Crypto broker without proper research to know what I was hoarding my hard-earned money into scammers, i lost access to my crypto wallet or had your funds stolen? Don’t worry Capital Crypto Recover is here to help you recover your cryptocurrency with cutting-edge technical expertise, With years of experience in the crypto world, Capital Crypto Recover employs the best latest tools and ethical hacking techniques to help you recover lost assets, unlock hacked accounts, Whether it’s a forgotten password, Capital Crypto Recover has the expertise to help you get your crypto back. a security company service that has a 100% success rate in the recovery of crypto assets, i lost wallet and hacked accounts. I provided them the information they requested and they began their investigation. To my surprise, Capital Crypto Recover was able to trace and recover my crypto assets successfully within 24hours. Thank you for your service in helping me recover my $647,734 worth of crypto funds and I highly recommend their recovery services, they are reliable and a trusted company to any individuals looking to recover lost money. Contact email [email protected] OR Telegram @Capitalcryptorecover Call/Text Number +1 (336)390-6684 his contact: [email protected] His website: https://recovercapital.wixsite.com/capital-crypto-rec-1
-
02.07.26 01:22
Lieneke Bonnema
I highly recommend ResQprofirm for their professional asset recovery services of my $120,000 scammed funds. Their expertise, professionalism, and commitment to achieving results make them a reliable choice for anyone seeking dependable recovery assistance. [email protected], WhatsApp +19852969146, telegram @resqprofirm
-
02.07.26 01:26
Clara Morin
I want to extend my deepest appreciation for showing that circumstances do not define one’s potential for greatness. Your support has been a major source of inspiration during my trading journey, and I am sincerely grateful for your insight and mentorship. Thank you so much. [email protected], WhatsApp +19852969146, telegram ResQprofirm
-
02.07.26 01:31
Robin Hale
I sincerely want to thank you for demonstrating that anyone can rise above their circumstances and achieve success. Your constant support has been incredibly inspiring during my trading journey, and your wisdom and advice mean so much to me. I appreciate you deeply. [email protected], WhatsApp +19852969146, telegram Resqprofirm
-
04.07.26 15:32
Fraddy Pual
There are few companies I trust as much as FUNDSRETRIEVER. When I lost $653,000 in Ethereum to a ruthless scam, I thought my life would never be the same. The betrayal cut deep, but I refused to give up. I searched tirelessly for a legitimate way to recover what was stolen, and finally found FUNDSRETRIEVER—the most competent and compassionate recovery team I could have imagined. They handled my case with precision and care, and in the end, my entire ETH wallet was restored. More than the money, they gave me back my hope and happiness. I'm sharing my story because I want others to know that recovery is possible. If a scam has taken from you, don't hesitate—contact FUNDSRETRIEVER today. Email: FUNDSRETRIEVER1@ Gmail.com | WhatsApp: +1 603-512-1448 | Telegram: @FUNDSRETRIEVER
-
05.07.26 14:44
lydiassmith567
HIRE A HACKER YOUR STOLEN CRYPTO RECOVERY / BTC / USDT / ETH WITH THE HELP OF CAPITAL CRYPTO RECOVER. I want to share my experience publicly regarding cryptocurrency wallet recovery, I highly recommend you to contact CAPITAL CRYPTO RECOVER, a professional private investigator in the Bitcoin world. They have a certified expert security team specializing in Bitcoin Recovery Services and have helped many people worldwide recover their lost funds. My wife and I were defrauded by an online manipulator posing as an experienced crypto investment professional. We lost $9.2 Million Stolen BTC in cryptocurrency and were left feeling homeless. After spending hours searching for a reliable crypto recovery service, I discovered CAPITAL CRYPTO RECOVER online. By patiently explaining my situation to their team, I was able to recover all my funds. Remarkably, my money was returned to my wallet in less than 24 hours. I am extremely grateful to CAPITAL CRYPTO RECOVER for their excellent assistance—they truly were a godsend in my difficult situation. If you have fallen victim to a cryptocurrency scam, you can reach CAPITAL CRYPTO RECOVER through the following channels Email: [email protected] OR Call/Text: +1 (336) 390-6684 Contact: [email protected] Website: https://recovercapital.wixsite.com/capital-crypto-rec-1
-
06.07.26 16:20
Olga Ognjanović
Having trouble withdrawing funds from an investment platform? ResQprofirm provides fund recovery assistance for individuals seeking help with investment-related disputes. I reached out to them after experiencing problems with an investment platform, and I appreciated their professionalism and support throughout the process. If you're facing a similar situation, act promptly, keep records of your transactions and communications, and seek assistance from a qualified recovery service or the appropriate authorities. Contact: Email: [email protected] Telegram: @ResQprofirm WhatsApp: +1 985 296 9146
-
06.07.26 16:31
Joseph Weigl
Invest wisely and stay cautious. Don't be influenced by promises of unusually high returns or convincing sales pitches from brokers. I learned this the hard way after falling victim to an investment scam that promised huge profits. Fortunately, I acted quickly and reported the incident to a recovery firm for assistance. Contact: Email: [email protected] Telegram: @Resqprofirm WhatsApp: +1 985 296 9146
-
06.07.26 16:33
Jaran Løvlien
A heartfelt thank you to RESQPRO FIRM for their commitment and professionalism throughout the investigation of my case. Their team worked diligently and helped recover assets valued at $88,000, which were returned to my wallet. I truly appreciate their support, clear communication, and dedication, and I'm grateful for the assistance I received. Contact: Email: [email protected] Telegram: @Resqprofirm WhatsApp: +1 985 296 9146
-
07.07.26 18:00
robertalfred175
CRYPTO SCAM RECOVERY SUCCESSFUL – A TESTIMONIAL OF LOST PASSWORD TO YOUR DIGITAL WALLET BACK. My name is Robert Alfred, Am from Australia. I’m sharing my experience in the hope that it helps others who have been victims of crypto scams. A few months ago, I fell victim to a fraudulent crypto investment scheme linked to a broker company. I had invested heavily during a time when Bitcoin prices were rising, thinking it was a good opportunity. Unfortunately, I was scammed out of $120,000 AUD and the broker denied me access to my digital wallet and assets. It was a devastating experience that caused many sleepless nights. Crypto scams are increasingly common and often involve fake trading platforms, phishing attacks, and misleading investment opportunities. In my desperation, a friend from the crypto community recommended Capital Crypto Recovery Service, known for helping victims recover lost or stolen funds. After doing some research and reading multiple positive reviews, I reached out to Capital Crypto Recovery. I provided all the necessary information—wallet addresses, transaction history, and communication logs. Their expert team responded immediately and began investigating. Using advanced blockchain tracking techniques, they were able to trace the stolen Dogecoin, identify the scammer’s wallet, and coordinate with relevant authorities to freeze the funds before they could be moved. Incredibly, within 24 hours, Capital Crypto Recovery successfully recovered the majority of my stolen crypto assets. I was beyond relieved and truly grateful. Their professionalism, transparency, and constant communication throughout the process gave me hope during a very difficult time. If you’ve been a victim of a crypto scam, I highly recommend them with full confidence contacting: Email: [email protected] Telegram: @Capitalcryptorecover Contact: [email protected] Call/Text: +1 (336) 390-6684 Website: https://recovercapital.wixsite.com/capital-crypto-rec-1
-
07.07.26 18:01
robertalfred175
CRYPTO SCAM RECOVERY SUCCESSFUL – A TESTIMONIAL OF LOST PASSWORD TO YOUR DIGITAL WALLET BACK. My name is Robert Alfred, Am from Australia. I’m sharing my experience in the hope that it helps others who have been victims of crypto scams. A few months ago, I fell victim to a fraudulent crypto investment scheme linked to a broker company. I had invested heavily during a time when Bitcoin prices were rising, thinking it was a good opportunity. Unfortunately, I was scammed out of $120,000 AUD and the broker denied me access to my digital wallet and assets. It was a devastating experience that caused many sleepless nights. Crypto scams are increasingly common and often involve fake trading platforms, phishing attacks, and misleading investment opportunities. In my desperation, a friend from the crypto community recommended Capital Crypto Recovery Service, known for helping victims recover lost or stolen funds. After doing some research and reading multiple positive reviews, I reached out to Capital Crypto Recovery. I provided all the necessary information—wallet addresses, transaction history, and communication logs. Their expert team responded immediately and began investigating. Using advanced blockchain tracking techniques, they were able to trace the stolen Dogecoin, identify the scammer’s wallet, and coordinate with relevant authorities to freeze the funds before they could be moved. Incredibly, within 24 hours, Capital Crypto Recovery successfully recovered the majority of my stolen crypto assets. I was beyond relieved and truly grateful. Their professionalism, transparency, and constant communication throughout the process gave me hope during a very difficult time. If you’ve been a victim of a crypto scam, I highly recommend them with full confidence contacting: Email: [email protected] Telegram: @Capitalcryptorecover Contact: [email protected] Call/Text: +1 (336) 390-6684 Website: https://recovercapital.wixsite.com/capital-crypto-rec-1
-
09.07.26 19:06
Toivo Walli
I lost 8.56btc to a fake Bitcoin mining site, I tried withdrawing but couldn't approved my process, I reported to !R£SQPROFIRM! via °R£SQproFirm°àt°gmail•com° °tEL£°gram=R£SQprofirm °whaT°Zap+198°52°96°91°46
-
09.07.26 19:10
Misty Alexander
Ongoing messages demanding more money before approving withdrawals are a major red flag. Stop engaging and report the incident to a trusted recovery team. For professional support, you can contact R£sQprofirm using °ResQproFirm°àt°g,*ma'il(•)¢m°, TEL£gram ResQprofirm, or |whaTZap| +1-985-296-9146.
-
09.07.26 19:13
Clara Soto
Anyone receiving continued requests for additional deposits from a scam platform should immediately cut off communication and submit the case to a reputable recovery service for investigation. R£sQprofirm is a dependable firm you can reach at °ResQproFirm°àt°g,*ma'il(•)¢om°, TEL£gram ResQprofirm, or |whaTZap| +1-985-296-9146.
-
12.07.26 03:30
Kora Baltacha
Time is critical. Act now by reaching out to a reputable, seasoned recovery specialist who will guide you every step of the way. You'll need to submit transaction proof, scammer details, and any other useful information. Armed with this, the experts can trace and attempt to pull your money back from the scammers' hidden accounts or wallets. Best of all, R£sQprofirm provides recovery help without charging any upfront fees. Contact them immediately via Telegram @ResQprofirm, WhatsApp +19852969146, or email [email protected].
-
 12.07.26 03:33
Pahal Mathew
12.07.26 03:33
Pahal Mathew
It's important to move proactively by engaging an experienced recovery specialist. They will assist you throughout the process. To help them, provide: · Transaction evidence · Scammer information · Any additional relevant details The experts will then track and try to retrieve your funds from the scammers' hidden accounts or wallets. R£sQprofirm offers recovery assistance with no upfront fees. Contact: Telegram: @ResQprofirm WhatsApp: +19852969146 Email: [email protected]
-
13.07.26 23:49
[email protected]
One of the biggest concerns I have about cryptocurrency is the lack of regulation. It creates opportunities for scammers to invent convincing stories and fraudulent investment schemes. Unfortunately, some social media platforms continue to display these ads because they profit from them, even after users report them.I personally clicked on a Facebook advertisement for a company called Chickenfastmining and ended up losing more than $120,000 in a scam. I reported the ad, but nothing was done. Later, through a Reddit community, I found a recovery service called CYBERBERSPY that, in my personal experience, they helped me recover $110,000 of my lost funds. If you've been a victim of a cryptocurrency scam, don't lose hope. Explore your options carefully, and always verify the legitimacy of any recovery service before trusting them or paying any fees. Based on my own experience, CYBERBERSPY was helpful to me and i was able to recover my funds back, but I encourage everyone to do their own research before using any recovery service.i highly recommend: ([email protected])
-
15.07.26 11:53
Sarah Green
Thank you for showing that success is possible regardless of where someone starts. Your encouragement, valuable advice, and continuous support have inspired me throughout my $160,457k crypto investment recovery journey. I truly appreciate your kindness and dedication. Resqprofirm @gmail.com Telegram: Resqprofirm
-
15.07.26 11:58
Lily Gagné
I sincerely appreciate you for proving that anyone can overcome challenges and achieve success. Your unwavering support throughout my trading investment scam of $88,890 recovery journey has been truly inspiring, and your guidance and wisdom have meant a great deal to me. Thank you for everything ResQprofirm@ gmail.com, ResQprofirm on the telegram.
-
16.07.26 21:38
patricialovick86
How To Recover Your Bitcoin Without Falling Victim To Scams: A Testimony Experience With Capital Crypto Recover Services, Contact Telegram: @Capitalcryptorecover Dear Everyone, I would like to take a moment to share my positive experience with Capital Crypto Recover Services. Initially, I was unsure if it would be possible to recover my stolen bitcoins. However, with their expertise and professionalism, I was able to fully recover my funds. Unfortunately, many individuals fall victim to scams in the cryptocurrency space, especially those involving fraudulent investment platforms. However, I advise caution, as not all recovery services are legitimate. I personally lost $273,000 worth of Bitcoin from my Binance account due to a deceptive platform. If you have suffered a similar loss, you may be considering crypto recovery, The Capital Crypto Recover is the most knowledgeable and effective Capital Crypto Recovery Services assisted me in recovering my stolen funds within 24 hours, after getting access to my wallet. Their service was not only prompt but also highly professional and effective, and many recovery services may not be trustworthy. Therefore, I highly recommend Capital Crypto Recover to you. i do always research and see reviews about their service, For assistance finding your misplaced cryptocurrency, get in touch with them, They do their jobs quickly and excellently, Stay safe and vigilant in the crypto world. Contact: [email protected] You can reach them via email at [email protected] OR Call/Text Number +1 (336)390-6684 his contact website: https://recovercapital.wixsite.com/capital-crypto-rec-1
-
17.07.26 19:24
laimqq90
I recommend Marie when it comes to recovering lost/stolen ust/bitcoin or any kind of cryptocurrencies' from fake investment platforms because they're well specialized in that area and you'll get your money back in full. I can boldly say this right now based on my prior deal i had with them; she was the only one who was able to recover my lost money $52,760 dollars back to my account, Only * ([email protected] and WhatsApp +1 7127594675 successful in recovering my money. They are the only one who can fully restore your lost funds to your account without any deductions, I really value their work and am recommending her to you today. THANK ME LATER
-
17.07.26 20:12
martinsjude080
Needs Online Fraud Help Contact Mighty Hacker Recovery https://mightyhackarrecovery.com I lost $292,900 in Bitcoin after investing with an online mining company. After realizing I had been scammed, I spent a long time searching for ways to recover my funds and contacted several services without success. During my research, I came across Mighty Hacker Recovery through Google and YouTube. What caught my attention was that they said they would not require any upfront payment before providing their recovery service. I decided to contact them to discuss my case and understand their process. Throughout the process, they kept me informed about the progress. After several days, I was asked to provide my Bitcoin wallet address, and my case was concluded. Their fee was handled after the service rather than being requested in advance. If you've been the victim of a cryptocurrency scam, it's important to do your own research, ask questions, and carefully evaluate any recovery service before proceeding. Every case is different, so take the time to verify information and understand the process before making any decisions. For Bitcoin scam recovery, cryptocurrency scam, crypto recovery service, recover stolen Bitcoin, Bitcoin fraud help, blockchain investigation, crypto wallet recovery, online investment scam, digital asset recovery, and crypto scam support. Contact Them on WhatsApp +1 (343) 947-3496 or [email protected] or [email protected] or https://mightyhackarrecovery.com Scam recovery Online fraud help Scam alert Report fraud Fraud investigation Fake website checker Scam checker Identity theft protection Consumer protection Chargeback for scam Wire transfer scam Tech support scam Employment scam Rental scam Shopping scam Email scam WhatsApp scam Telegram scam Facebook scam Instagram scam
-
18.07.26 17:12
Malthe Larsen
My experience with OKX has been deeply frustrating. For months, my account withdrawals were restricted with no explanation or resolution. Multiple emails to their support team were ignored, leaving me without answers or reassurance. This complete lack of communication shattered my trust. I ultimately regained access to my funds only through the help of a third-party recovery service, ResQProfirm. What should have been a reliable platform instead made me feel helpless and cut off from my own assets. [email protected], WhatsApp +19852969146, telegram @Resqprofirm
-
18.07.26 17:42
پریا رضایی
OKX has been a major disappointment. My withdrawals were restricted for months, and repeated attempts to contact support went unanswered. This silence destroyed my confidence in the platform. I was only able to recover my funds through a third-party service, ResQProfirm. I trusted OKX for its reliability, but the experience left me feeling trapped and helpless. Timely communication and access to one’s own money should be a basic standard. [email protected], WhatsApp +19852969146, telegram: ResQprofirm
-
18.07.26 17:46
Adem Akışık
I truly didn’t expect such an outstanding outcome. Recovering my $49,360 felt impossible at first, but ResQprofirm’s dedication and persistence made it happen. I hold their team in the highest regard. [email protected], WhatsApp +19852969146
-
18.07.26 23:51
bernalzenaida
WhatsApp https://wa.link/fhle97 Telegram https://msng.link/o?@techcyberforc=tg As cryptocurrency continues to reshape global finance, cybercriminals are finding new ways to exploit investors through scams, hacks, phishing attacks, fake investment platforms, and other forms of digital asset fraud. For many victims, knowing where to turn after a loss can be one of the biggest challenges. Techy Force Cyber Retrieval was founded with one clear mission: to give victims of crypto fraud a fighting chance through professional blockchain investigations and cybersecurity expertise. Our team brings together experienced blockchain analysts, digital forensic specialists, cybersecurity professionals, and legal partners who work collaboratively to investigate cryptocurrency-related crimes. Using advanced blockchain forensic tools and global investigative techniques, we analyze transaction histories, trace digital asset movements where possible, identify valuable investigative leads, and prepare evidence that may assist clients and the appropriate authorities. We believe blockchain should represent transparency, accountability, and trust—not fear. That’s why we’re committed to helping victims understand their options, navigate the investigative process, and take informed action after cryptocurrency fraud. Every case is different, and while no legitimate recovery service can promise a successful recovery, acting quickly and working with experienced professionals can improve the quality of an investigation. At Techy Force Cyber Retrieval, we do more than investigate digital crimes—we advocate for victims, pursue the facts, and help people regain confidence after cryptocurrency fraud. WhatsApp https://wa.link/fhle97 Telegram https://msng.link/o?@techcyberforc=tg Crypto fraud doesn’t have to be the end of the road. It’s where our investigation begins.
-
19.07.26 04:10
Fraddy Pual
I can't thank Fundsretriever enough for everything they did for me. My name is Vanessa Conway, and I'm here to tell you my story of how I recovered money I never thought I'd see again. A few months ago, I put a significant amount of money into what looked like a genuine online investment company. At first, it felt real—they showed me fake profits and convinced me to invest even more. But when I tried to cash out, they went quiet and started asking for extra fees. That's when it hit me—I had been scammed. I was heartbroken, frustrated, and didn't know where to turn. That money was my savings—months of hard work gone. Then I found Fundsretriever online. I reached out, hoping for a miracle. Right away, their team made me feel heard. They were responsive, knowledgeable, and walked me through everything. They didn't just take my case—they took it seriously and kept me in the loop every step of the way. I finally felt like I had real experts fighting for me. And guess what? They actually got my money back. It wasn't instant, and it took teamwork, but it happened. When I saw those funds returned, I cried with joy. I'm sharing this so that anyone else out there who's been scammed knows—don't lose hope. Do your research before investing, and stay far away from platforms that promise too much too fast. And if you've already been stung, don't wait—get professional help immediately. Thank you, Fundsretriever, from the bottom of my heart. You didn't just recover my money—you restored my faith. — Vanessa Conway 📧 [email protected] 📱 WhatsApp: +16035121448 💬 Telegram: @Fundsretriever
-
19.07.26 19:53
kimberlyhebertt6877
I invested in bitcoin trading After losing $78.4 USDT) linked to a romance fraud scam worth of cryptocurrency through an online investment platform and later discovered it was a scam. After extensive research for recovery options, I contacted CAPITAL CRYPTO RECOVER based on positive client reviews and recommendations. Their professional security team guided me through the recovery process using advanced technology, and I was able to recover my lost cryptocurrency successfully. I am truly grateful for their support and assistance during such a difficult experience. I will advise you to contact CAPITAL CRYPTO RECOVER helped me recover my funds. For anyone facing similar issues, Website: https://recovercapital.wixsite.com/capital-crypto-rec-1 Email: [email protected] Telegram: @Capitalcryptorecover Contact: [email protected] Call/Text Number: +1 (336) 390-6684
-
19.07.26 19:54
kimberlyhebertt6877
I invested in bitcoin trading After losing $78.4 USDT) linked to a romance fraud scam worth of cryptocurrency through an online investment platform and later discovered it was a scam. After extensive research for recovery options, I contacted CAPITAL CRYPTO RECOVER based on positive client reviews and recommendations. Their professional security team guided me through the recovery process using advanced technology, and I was able to recover my lost cryptocurrency successfully. I am truly grateful for their support and assistance during such a difficult experience. I will advise you to contact CAPITAL CRYPTO RECOVER helped me recover my funds. For anyone facing similar issues, Website: https://recovercapital.wixsite.com/capital-crypto-rec-1 Email: [email protected] Telegram: @Capitalcryptorecover Contact: [email protected] Call/Text Number: +1 (336) 390-6684
-
30.07.26 00:04
Ahmed
A really cool analysis, thank you. I was especially struck by how strictly the order is defined: data processing and formatting come first, with color only at the very end. This really saves you from the typical mistake of "first a pretty palette, then we figure out what the chart is for." And the palette validator with OKLCH + colorblindness check is absolutely fantastic; you almost never see that in regular tools. By the way, while reading about rank-trajectory and the logarithmic scale, I immediately remembered how convenient it is to analyze dynamics on charts in ExpertOption—I've been trading there for quite some time now. When the data is well visualized, decisions are noticeably easier and more relaxed. I also liked the point about "no more than eight colors" and the dual-axis ban. Strict restrictions sometimes actually produce better results than complete freedom. I'll try this approach myself.
-
30.07.26 17:27
wendytaylor015
My name is Wendy Taylor, I'm from Los Angeles, i want to announce to you Viewer how Capital Crypto Recover help me to restore my Lost Bitcoin, I invested with a Crypto broker without proper research to know what I was hoarding my hard-earned money into scammers, i lost access to my crypto wallet or had your funds stolen? Don’t worry Capital Crypto Recover is here to help you recover your cryptocurrency with cutting-edge technical expertise, With years of experience in the crypto world, Capital Crypto Recover employs the best latest tools and ethical hacking techniques to help you recover lost assets, unlock hacked accounts, Whether it’s a forgotten password, Capital Crypto Recover has the expertise to help you get your crypto back. a security company service that has a 100% success rate in the recovery of crypto assets, i lost wallet and hacked accounts. I provided them the information they requested and they began their investigation. To my surprise, Capital Crypto Recover was able to trace and recover my crypto assets successfully within 24hours. Thank you for your service in helping me recover my $647,734 worth of crypto funds and I highly recommend their recovery services, they are reliable and a trusted company to any individuals looking to recover lost money. Contact email [email protected] OR Telegram @Capitalcryptorecover Call/Text Number +1 (336)390-6684 his contact: [email protected] His website: https://recovercapital.wixsite.com/capital-crypto-rec-1
-
31.07.26 16:21
rssllhrnsb
I learned an important lesson after investing in what appeared to be a genuine opportunity. Unfortunately, I was unable to access my funds, which reinforced the importance of carrying out thorough due diligence, checking whether an investment is appropriately regulated, and seeking qualified professional advice rather than relying solely on online reviews or testimonials. During the process of addressing my case, I worked with Mrs. Doris Ashley, who communicated clearly, provided regular updates, and handled the matter in a professional manner. According to my experience, I have recovered $50,000 so far, while efforts to resolve the remaining balance are still in progress. If you wish to contact her, the details I used are: Mrs. Tatiana Sorina TEXT : (tatianasorina06 at G.Ma IL ..c 0 m ) Before committing money to any investment, take time to verify the legitimacy of the platform, confirm any relevant regulatory authorisations, and avoid investing more than you can comfortably afford to lose.
-
01.08.26 15:05
keithwilson9899
ETHEREUM RECOVERY ASSISTANCE: CAPITAL CRYPTO RECOVER HELPED ME RECOVER $98,000 WORTH OF LOST ETH In cases of cryptocurrency scams, having accurate information and trusted support is essential. I would like to recommend Capital Crypto Recover Service, a professional team that specializes in assisting individuals with the recovery of lost or stolen Bitcoin and Ethereum (ETH). Their experienced experts are dedicated to helping victims of digital asset fraud by carefully analyzing each case, developing strategic recovery plans, Capital Crypto Recover Service knowledgeable team's primary goals are to satisfy clients and offer significant support and working diligently toward fund retrieval. The team is committed to providing reliable assistance and maintaining a high level of client satisfaction. Based on my assessment, their reputation professionalism and a strong commitment to their clients. If you have experienced a cryptocurrency loss, you can contacting them for further assistance Phone (Call/Text): +1 (336) 390-6684 Email: [email protected] Alternate Email: [email protected] Website: https://recovercapital.wixsite.com/capital-crypto-rec-1
To join the Chat, you need a free pro-blockchain.com account.
Enter
Registration
Authorization
Registration
Similar news
Финансовые рынки от TradingView